

Hello Readers!
Reading Indian stocks can become difficult very quickly. The NSE and BSE have thousands of listed companies, and every trading session brings new price movements, company announcements, quarterly results, sector news, dividends and changes in investor sentiment.
For a beginner, the biggest problem is often not a lack of information. It is the opposite. There is simply too much information.
You may open one chart for a stock, then check RSI, moving averages, volume, quarterly results, sector performance, dividend dates and news. After twenty minutes, you may have more tabs open but still have no clear idea whether the stock deserves deeper research.
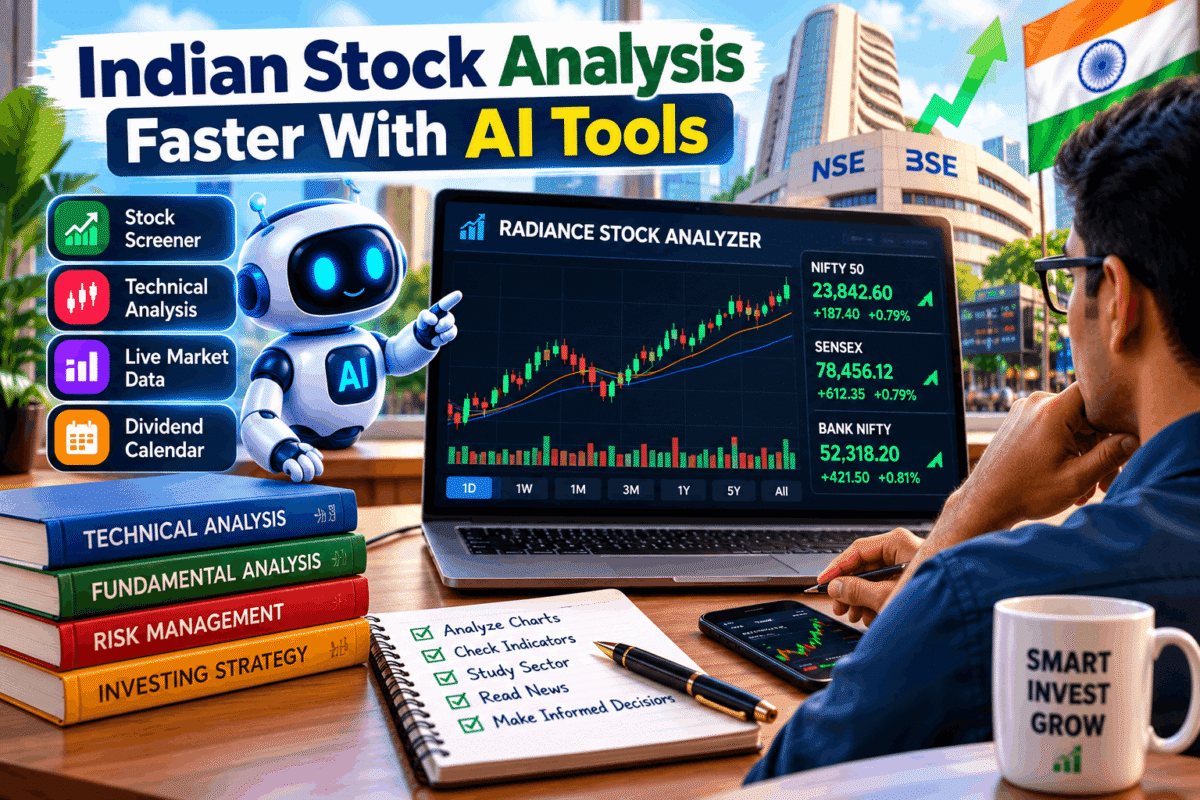
This is where AI tools, stock radar tools and structured stock research workflows can save time.
What Is a Stock Radar Tool?
A stock radar tool is a market-scanning system that helps investors narrow a large list of Indian stocks into a smaller group that deserves attention.
Instead of manually opening hundreds of charts, a radar can filter stocks using conditions such as price movement, trend, RSI, moving averages, trading volume, sector activity and corporate events.
For example, suppose an investor wants to find Indian stocks showing improving momentum. Instead of checking every NSE-listed company manually, the investor can start with a filtered list and then examine the individual charts.
This changes the research process from:
Thousands of stocks → hundreds of charts → confusion
to:
Market → filtered candidates → verification → research decision
The difference is important. A radar is not supposed to tell you what to buy. Its job is to help you decide which stocks deserve your attention first.
Why AI Tools Can Make Indian Stock Research Faster
Traditional stock research often requires several separate steps. You may check the price on one website, the chart on another, company results somewhere else and dividend information on another page.
AI-assisted research can help organise these pieces of information into a more understandable workflow.
For example, an AI research assistant can help explain:
- What changed in the stock price?
- Is the current trend positive, negative or mixed?
- What do the major moving averages indicate?
- Is RSI showing momentum or possible exhaustion?
- Has trading volume increased?
- Are there recent quarterly results to study?
- Is there a dividend or corporate event nearby?
- Is the sector supporting the stock’s movement?
The important point is that AI should help organise information. It should not turn incomplete information into a confident investment conclusion.
How to Read Indian Stocks Faster With a Simple Workflow
A practical workflow can be divided into five stages:
- Screen the market.
- Check the trend.
- Confirm momentum and volume.
- Study the company and sector.
- Make a research decision based on your own rules.
This process is much cleaner than jumping directly from a social media post to a stock purchase.
Step 1: Start With a Stock Radar
The first step is to reduce the number of stocks you need to inspect.
A radar can be configured around different research objectives. For example, one investor may be interested in stocks near support, while another may want stocks showing strong momentum. A long-term investor may care more about quarterly results, earnings growth and valuation.
That means there is no single “perfect” radar list.
The useful radar is the one that matches your research question.
Step 2: Check Price Trend and Moving Averages
Once a stock appears on the radar, the next step is to understand its trend.
Moving averages such as the 9 EMA, 20 EMA and 50 EMA can help investors understand short-term and medium-term price structure.
| Indicator | What It Can Help You Understand | What You Should Avoid |
|---|---|---|
| 9 EMA | Short-term price momentum | Treating one crossover as a guaranteed signal |
| 20 EMA | Short-to-medium trend structure | Ignoring the broader market trend |
| 50 EMA | Medium-term trend direction | Using it alone to make an investment decision |
For example, a stock trading above several moving averages may show stronger technical structure than a stock consistently trading below them. But that observation alone does not tell you whether the company’s valuation is reasonable.
Technical analysis and fundamental research answer different questions. Combining them can create a more balanced research process.
Why RSI Matters in Stock Radar Analysis
RSI, or Relative Strength Index, is one of the most widely used momentum indicators in technical analysis.
It helps investors study the speed and strength of recent price movements. However, RSI should not be treated as a simple “buy below this number, sell above that number” machine.
The U.S. Securities and Exchange Commission’s investor education material describes RSI as a momentum oscillator that compares recent gains and losses. You can read the official explanation on the SEC Investor.gov RSI page.
In a radar workflow, RSI becomes more useful when combined with trend and volume.
Consider two examples:
- A stock is near support, RSI is recovering and volume is improving.
- A stock has already moved sharply, RSI is elevated and volume is falling.
Both stocks may appear strong on a headline chart, but the underlying situations are different.
Volume: The Missing Part of Many Stock Screens
Price tells you what happened. Volume can provide additional information about participation in that move.
Suppose a stock rises 5% but trading volume remains unusually low. Another stock rises 5% while volume is significantly above its recent average. The price movement is identical, but the market participation is different.
This is why a useful stock radar should not focus only on price.
Investors can compare:
- Current volume versus recent average volume
- Price breakout with volume confirmation
- Volume during pullbacks
- Volume around quarterly results
- Volume around major corporate announcements
Volume does not guarantee that a breakout will succeed. It simply gives another piece of evidence to examine.
How Sector Strength Can Improve Stock Research
A stock does not move in isolation.
Banking stocks can react to interest-rate expectations and credit conditions. IT stocks can respond to global technology spending and currency movements. Pharma stocks may react to regulatory developments and product approvals. Auto stocks can respond to monthly sales, commodity costs and consumer demand.
Because of this, checking the sector before making a conclusion can be useful.
Suppose an individual banking stock is showing a strong breakout while the broader banking sector is also strengthening. That combination deserves a different level of attention from a breakout happening while most peers are weakening.
This is one reason the StockRadiance Sector Dashboard can be useful as a research companion.
How to Combine Technical and Fundamental Analysis
Technical analysis can help answer:
- What is the current price trend?
- Where are important support and resistance areas?
- Is momentum improving?
- Is volume confirming the move?
Fundamental analysis asks different questions:
- Is revenue growing?
- Are profits improving?
- What is happening to margins?
- How much debt does the company carry?
- Is cash flow healthy?
- How does the current valuation compare with earnings?
- What risks could affect the business?
A stock can have a strong chart and weak fundamentals. It can also have strong fundamentals but poor short-term price action.
That is why a research workflow should not force one method to answer every question.
Using AI to Read Quarterly Results Faster
Quarterly results can contain a large amount of information. Revenue, EBITDA, profit, margins, debt, cash flow, segment performance and management commentary can all matter.
AI can help investors summarise a long earnings release into a structured checklist.
For example, you can ask an AI research tool to organise a quarterly result into:
| Area | What to Check |
|---|---|
| Revenue | Year-on-year and sequential growth |
| Profit | Growth and margin movement |
| Cash Flow | Operating cash generation |
| Debt | Borrowing trend and interest burden |
| Segments | Which business is driving growth |
| Management Commentary | Guidance, demand and major risks |
But investors should still verify important numbers against the company’s official filing or exchange disclosure.
Dividend Tracking Is Part of Stock Research
Dividends can become important when researching mature companies and income-oriented portfolios.
Investors should distinguish between the:
- Declaration date – when the company announces the dividend.
- Record date – the date used to determine eligible shareholders.
- Ex-dividend date – the date from which the stock trades without the entitlement under the applicable market process.
- Payment date – when the dividend is paid.
Investors should always verify the exact dates from official company or exchange disclosures because corporate-action details can change.
You can also use the StockRadiance Dividend Calendar as part of your research workflow.
Why Live Indian Stock Data Matters
Indian markets can change quickly during the trading session.
A stock that looked technically strong at 10:00 AM may look very different after an earnings announcement, sector-wide sell-off, block deal or major global market move.
This is why live market visibility can be useful for active market participants.
However, live data should not create the habit of watching every tick.
The purpose of a live dashboard should therefore be simple: identify meaningful changes and then investigate them.
NSE vs BSE: What Should Investors Watch?
NSE and BSE are both important Indian stock exchanges, but investors should not treat exchange visibility as a substitute for company research.
When checking a stock, investors can verify:
- Current market price
- Trading volume
- Corporate announcements
- Results and financial disclosures
- Corporate actions
- Listing and security details
For official exchange information, investors can visit the National Stock Exchange of India and the BSE India website.
How Beginners Can Use a Stock Radar Safely
A beginner may see ten stocks highlighted on a radar and immediately assume that all ten are opportunities.
That is the wrong way to use the tool.
A radar list is a starting point for research, not a buy list.
Before researching any highlighted stock, ask:
- Why has this stock appeared on the radar?
- Is the movement supported by volume?
- What does the daily chart show?
- What does the weekly chart show?
- Is the sector also moving?
- Are quarterly results due soon?
- Is there a major corporate announcement?
- Is the stock already far above its recent range?
- What could make the thesis wrong?
These questions force the investor to investigate instead of reacting.
What AI Should Not Do for Investors
AI tools are useful, but they have limitations.
An AI-generated stock explanation can contain outdated information, incorrect assumptions or incomplete context. Even when the information looks convincing, investors should verify important financial numbers and corporate announcements through primary sources.
AI should not be used as a replacement for:
- Company annual reports
- Quarterly financial results
- NSE and BSE disclosures
- SEBI regulatory information
- Investor presentations
- Risk assessment
- Personal financial planning
The SEBI official website is an important source for regulatory information and investor-related resources.
Three Indicators Are Often Better Than Eight
Adding more indicators does not automatically make a trading setup stronger.
One trader may use RSI, another may prefer MACD, while another may rely heavily on moving averages and volume. The important thing is whether the indicators answer different questions.
A simple technical workflow could be:
- Trend: Use moving averages to understand direction.
- Momentum: Use RSI to understand strength.
- Participation: Use volume to see whether the move has market activity.
If all three indicators tell you exactly the same thing, adding five more indicators may not improve the analysis.
How to Build a Faster Daily Stock Research Routine
A practical daily routine does not need to involve hundreds of charts.
Before Market Open
- Check major global market movements.
- Review important Indian market news.
- Check corporate results and announcements.
- Review sectors showing unusual activity.
- Prepare a small watchlist.
During Market Hours
- Watch only stocks that match your research rules.
- Check price and volume together.
- Look for major changes rather than every tick.
- Track sector confirmation.
- Be careful around sudden news-driven moves.
After Market Close
- Review what actually happened.
- Compare the stock with its sector.
- Study major gainers and losers for context.
- Review corporate announcements.
- Update the next-session watchlist.
This process creates a repeatable system. It also makes it easier to identify when a trading decision came from a predefined rule and when it came from emotion.
Stock Radar vs Manual Stock Research
| Manual Research | Radar-Assisted Research |
|---|---|
| Open many charts individually | Start with filtered candidates |
| More time spent searching | More time available for verification |
| Easy to miss smaller signals | Filters can surface matching setups |
| More tabs and repeated work | Structured workflow |
| Highly dependent on routine | Rules can be repeated consistently |
This does not mean radar-assisted research is automatically better. A poorly designed filter can produce poor candidates very quickly.
The quality of the rules matters more than the number of stocks the tool can scan.
How StockRadiance Fits Into This Workflow
StockRadiance is designed around the idea of bringing several parts of Indian stock research closer together.
Investors can explore the StockRadiance Technical Analysis page for technical indicators and chart-based research.
The Stock Screener can help narrow the market based on research requirements.
For AI-assisted stock research, the Radiance AI Stock Analyzer can be used as another research layer.
The Sector Dashboard can help investors look beyond an individual stock and understand broader sector activity.
For a broader list of companies and market research, investors can also explore the Top 50 Stocks section.
A Simple Stock Research Example
Imagine that a mid-cap bank suddenly appears on a stock radar.
The first step should not be “Should I buy it?”
Instead, start with:
- What caused the stock to appear?
- Is the price above its major moving averages?
- Is RSI confirming momentum?
- Has volume increased?
- Is the banking sector also strong?
- Are quarterly results approaching?
- Has the company announced anything important?
- What does the valuation look like?
- What are the major downside risks?
Only after these questions are answered should the stock move from a radar list into a deeper research list.
This is the difference between finding a stock and understanding a stock.
Common Mistakes When Using AI Stock Tools
1. Treating AI as a Prediction Machine
AI can analyse information, but market prices can change because of new information that was not available when the analysis was generated.
2. Following Every Radar Signal
A radar can generate many candidates. Not every candidate deserves capital or even a detailed trade plan.
3. Ignoring Fundamentals
A technically attractive chart does not automatically mean that the underlying company is financially healthy.
4. Ignoring Risk
Every investment or trading idea needs a clear understanding of what could go wrong.
5. Using Too Many Indicators
A crowded chart can create the illusion of better analysis while actually making decisions harder.
6. Trusting Social Media Before Official Sources
Market rumours can spread quickly. Important corporate information should be checked against official disclosures whenever possible.
What Makes a Good Indian Stock Analysis Tool?
A useful stock research platform does not need hundreds of flashy features.
It should make basic research easier.
Useful features include:
- Reliable market data
- Clear technical charts
- Stock screening
- Trend and momentum indicators
- Volume analysis
- Sector comparison
- Corporate-event tracking
- Dividend information
- Company fundamentals
- Easy-to-understand summaries
Most importantly, the information should be presented in a way that helps the investor investigate further rather than simply producing a conclusion.
Final Takeaway: Use AI to Save Time, Not to Skip Research
The Indian stock market produces a huge amount of information every day. Trying to manually process everything is neither practical nor necessary.
A stock radar can reduce the number of charts you need to inspect. AI can help organise information. RSI and moving averages can provide technical context. Volume can help confirm participation. Sector analysis can provide a broader market view. Dividend and corporate-event tracking can prevent important dates from being missed.
But none of these tools removes the need for judgment.
The strongest workflow is simple:
That approach keeps technology in its proper place. AI and automation can make stock research faster, but the final research responsibility still belongs to the investor.
If you are building a daily Indian stock research routine, start with a small watchlist, use a few meaningful indicators, verify important information through official sources and avoid making decisions simply because a stock appears on a radar.
That is how a stock radar becomes a research tool rather than another source of market noise.
Related StockRadiance Research Tools
📊 Technical Analysis – Study price trend, RSI, EMA, support and resistance.
🔎 Stock Screener – Filter Indian stocks based on research criteria.
🤖 Radiance AI Stock Analyzer – Explore AI-assisted stock research.
📈 Sector Dashboard – Track sector-level market activity.
💰 Dividend Calendar – Track dividend-related market events.
📚 Finance Tools – Explore useful financial calculators and tools.
Find trending Indian stocks & market setups
→
Check RSI, EMA, trend, support & resistance
→
Get AI-powered Indian stock market insights
→
Track sectors, stocks & daily market performance
→
Frequently Asked Questions : Stock Radar Tool
What is a stock radar tool?
A stock radar tool scans a large group of stocks and highlights those that match selected conditions such as trend, RSI, volume, price movement or corporate events. It is a research filter, not a guaranteed trading signal.
Can AI analyse Indian stocks?
AI can help organise market information, explain indicators, summarise financial documents and compare research points. Important financial data should still be verified through official company and exchange sources.
Is RSI enough to select a stock?
No. RSI is a momentum indicator. Investors can combine it with price trend, moving averages, volume, sector strength and fundamental information.
How can beginners use a stock radar?
Beginners should use a radar to create a shortlist, then manually verify the chart, volume, sector, company news, financial results and risks before making any decision.
Does a radar signal mean I should buy the stock?
No. A radar signal only means that a stock matches the conditions used by the screening system. It does not establish whether the stock is suitable for a particular investor.
Why is volume important in stock analysis?
Volume shows trading activity and can provide additional context when a stock rises, falls or breaks through a technical level. It should be considered alongside price and market conditions.
Should I use many technical indicators?
Not necessarily. A simple combination of trend, momentum and volume can be easier to interpret than a chart containing many overlapping indicators.
Where can I verify Indian stock information?
Investors can verify listed-company announcements and market information through official exchange sources such as NSE and BSE, and regulatory information through SEBI.
Disclaimer: This article is for educational and informational purposes only. Stock radar tools, technical indicators and AI-assisted analysis can contain limitations and should not be treated as guaranteed predictions or personalised investment advice. Investors should conduct independent research and verify important information through official company, NSE, BSE and SEBI sources. Market investments are subject to risk.
Thanks for Reading!
Thank you for reading this StockRadiance guide on using AI tools and stock radar systems for faster Indian stock research. Keep learning, verify the numbers and make research-based decisions.
Contents
- 1. What Is a Stock Radar Tool?
- 2. Why AI Tools Can Make Indian Stock Research Faster
- 3. How to Read Indian Stocks Faster With a Simple Workflow
- 4. Why RSI Matters in Stock Radar Analysis
- 5. Volume: The Missing Part of Many Stock Screens
- 6. How Sector Strength Can Improve Stock Research
- 7. How to Combine Technical and Fundamental Analysis
- 8. Using AI to Read Quarterly Results Faster
- 9. Dividend Tracking Is Part of Stock Research
- 10. Why Live Indian Stock Data Matters
- 11. NSE vs BSE: What Should Investors Watch?
- 12. How Beginners Can Use a Stock Radar Safely
- 13. What AI Should Not Do for Investors
- 14. Three Indicators Are Often Better Than Eight
- 15. How to Build a Faster Daily Stock Research Routine
- 16. Stock Radar vs Manual Stock Research
- 17. How StockRadiance Fits Into This Workflow
- 18. A Simple Stock Research Example
- 19. Common Mistakes When Using AI Stock Tools
- 20. What Makes a Good Indian Stock Analysis Tool?
- 21. Final Takeaway: Use AI to Save Time, Not to Skip Research
- 22. Related StockRadiance Research Tools
- 23. Frequently Asked Questions : Stock Radar Tool
- 23.1. What is a stock radar tool?
- 23.2. Can AI analyse Indian stocks?
- 23.3. Is RSI enough to select a stock?
- 23.4. How can beginners use a stock radar?
- 23.5. Does a radar signal mean I should buy the stock?
- 23.6. Why is volume important in stock analysis?
- 23.7. Should I use many technical indicators?
- 23.8. Where can I verify Indian stock information?


